UPDATED 31st March 2023.
Ascential data is uniquely positioned to offer deep fundamental insights into the clothing businesses worldwide. In the example below, we discuss how using Ascential data on the Exabel platform allows analysts to successfully get an early read on Lululemon’s gross margins and inventory levels ahead of its earnings call this week.
Utilizing the unparalleled discounting information available on the platform not only allows for analysis of the breadth and depth of discounting trends of the company as a whole but also provides the option to focus on the pricing trends of Lulu’s marquee products and notice the significant rise in discounting overall as compared to past quarter/year – which led to the decreased gross margins reported by Lulu this week. However, the insights aren’t only limited to the discounting trends; by combining the SKU level information with availability and the ability to compare the availability trends across quarters, the inventory buildup reported by Lululemon also becomes easily foreseeable.
Original blog:
As the leading source of information on the pricing trends of clothing retailers and manufacturers around the globe, Ascential is the best place to help analysts better understand trends in the industry and insights behind specific companies in the apparel sector.
You can access a free trial of Ascential’s dataset.
In this example, we examine how the pricing strategy at Lululemon has evolved during the current quarter and its effect on discounting levels and inventory across major product categories.
Being the premium luxury activewear brand with a very high majority of its products being sold only through the direct-to-consumer channel, Lululemon operates its business with extensive gross margins. However, during the last earnings call, Lulu’s management cited that its margins had declined by 130bps YoY, attributed to higher markdowns and an unfavorable comparison to inventory in Q3 2021. Given the importance of the gross margins to Lulu’s valuation, we analyze one of the main drivers behind Lululemon Athletica’s margins: its ability to charge higher prices and the discounting patterns observed so far in Q4 while paying special attention on its marquee category of workout trousers/pants/leggings and to a lesser extent Bras & Tops.
First, we begin by looking at the pricing trends of Lululemon in the US, shown in the figure below. Here the solid line represents the average listed price of all the Lululemon products on their website. Comparing it to the dotted line, which shows the average listed price of the products the year ago, we can see that the current prices have been chiefly in line albeit slightly higher than those in the last year.

At a surface level, based on the pricing trends, an investor might expect the discounting trends to be similar to last year. However, that is far from the truth. As shown in the figure below, the breadth of discounting at Lululemon has taken a sharp upwards turn in FQ4’22 and, as a result, is currently at its highest ever during the past two years. Yet, we have seen no such upward trend in the depth of discounting at Lululemon.

Looking at the high number of discounted products at Lululemon, it is natural to ask how the discounts are distributed over the different product categories to better understand their impact on Lululemons’s gross margin.

To answer this question, we look at the chart above, which breaks down the three major categories at Lululemon and depicts their discounting trends. We can clearly see that the breadth of discounting for these three categories rose dramatically at the start of Q4, and the trend continued well into February.

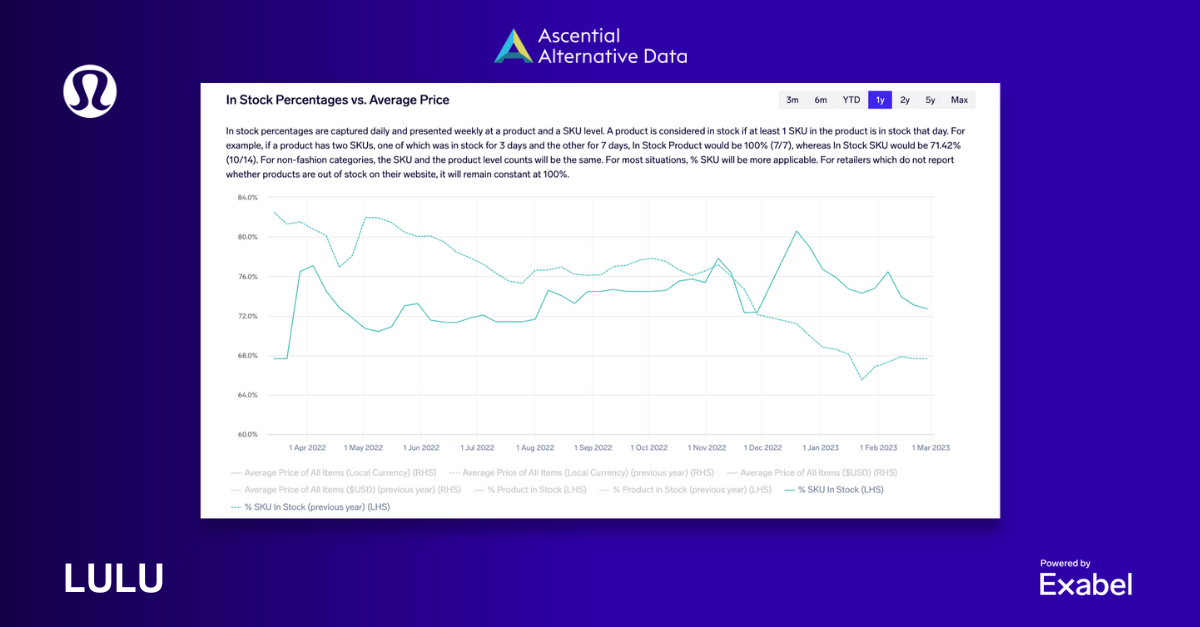
As expected, the increase in the breadth of discounting has led to a decrease in % SKU in Stock. However, despite the unprecedented levels of discounting, we can see the inventory levels have remained considerably higher than the previous year. This aligns with management’s commentary in the Q3 earnings call, where they forecasted elevated inventory levels to persist into 2023.
Based on the above Analysis, we can conclude that although Lululemon still commands high prices for its products, it has dramatically increased the number of discounted products in Q4. Furthermore, we can see that these discounts have been increased in key high-margin categories such as bottoms, bras, etc. Despite these discounts, inventory levels remain higher than in the previous quarter. Therefore, it is reasonable to expect its gross margins to shrink further in Q4 and given the trends in the first two months in FQ1’23 to continue shrinking in the current quarter as well.
About the dataset
The Ascential dataset is a curated offering of pricing and promotion insights for equity analysts and portfolio managers. Through meticulously scraping information on over 35 billion records collected over the past nine years, Ascential provides a unique view into corporate pricing strategies, discounting levels, and even wholesaler/retailer dynamics.
Hosted on the Exabel platform, a proven alternative data investment research platform used by many of the world’s leading investment teams to make better, data driven investment decisions. As Ascential is retained by retailers to obtain this data, there is significantly lower compliance risk – notably, the company has never received a cease and desist from a retailer. Ascential has become the industry-leading source of pricing and promotion insights for retailers and financial professionals alike.
General disclaimer
This document is provided by Exabel AS. It is for information purposes only. It is not an invitation or inducement to engage in any investment activity and it does not contain investment advice. The information in this document shall not be relied on in making any investment decision or in connection with any contract or otherwise. Exabel AS makes no representation regarding, and accepts no liability or duty of care for, the accuracy, completeness or timeliness of the information in this document or its fitness for any particular purpose or use.


