Alternative data has the potential to add much needed clarity in the face of the unprecedented uncertainty-driven disruption in capital markets we see these days. We at Exabel have worked with 1010data to launch the COVID-19 Impact Dashboard in record time, and deliver it as a freely available, near-real time source of insight for the public.
Monitor consumer spending behaviour across the US
- We all know markets, sectors and companies have been affected by the crisis, but quantitatively how large has that effect been in absolute and relative terms?
- While we all look forward to markets rebounding, how do we know when we’ve “hit bottom” and the market, sectors or companies we care about are inflecting back to growth?
- Which sectors, in the midst of this crisis, are bucking the trends and why might that be?
These are among the questions that the dashboard will help answer. Compared to other static alternative data reports and analyses released over the past few days this is notable as being the first and only continually updating near-real time resource.
We are proud to be partnering with 1010data for this project. 1010data are amongst the most mature and well respected of alternative data vendors. Their credit card and location data sets are based on large, representative panels, which provide potent and reliable insight into changes in consumer spending across the United States.
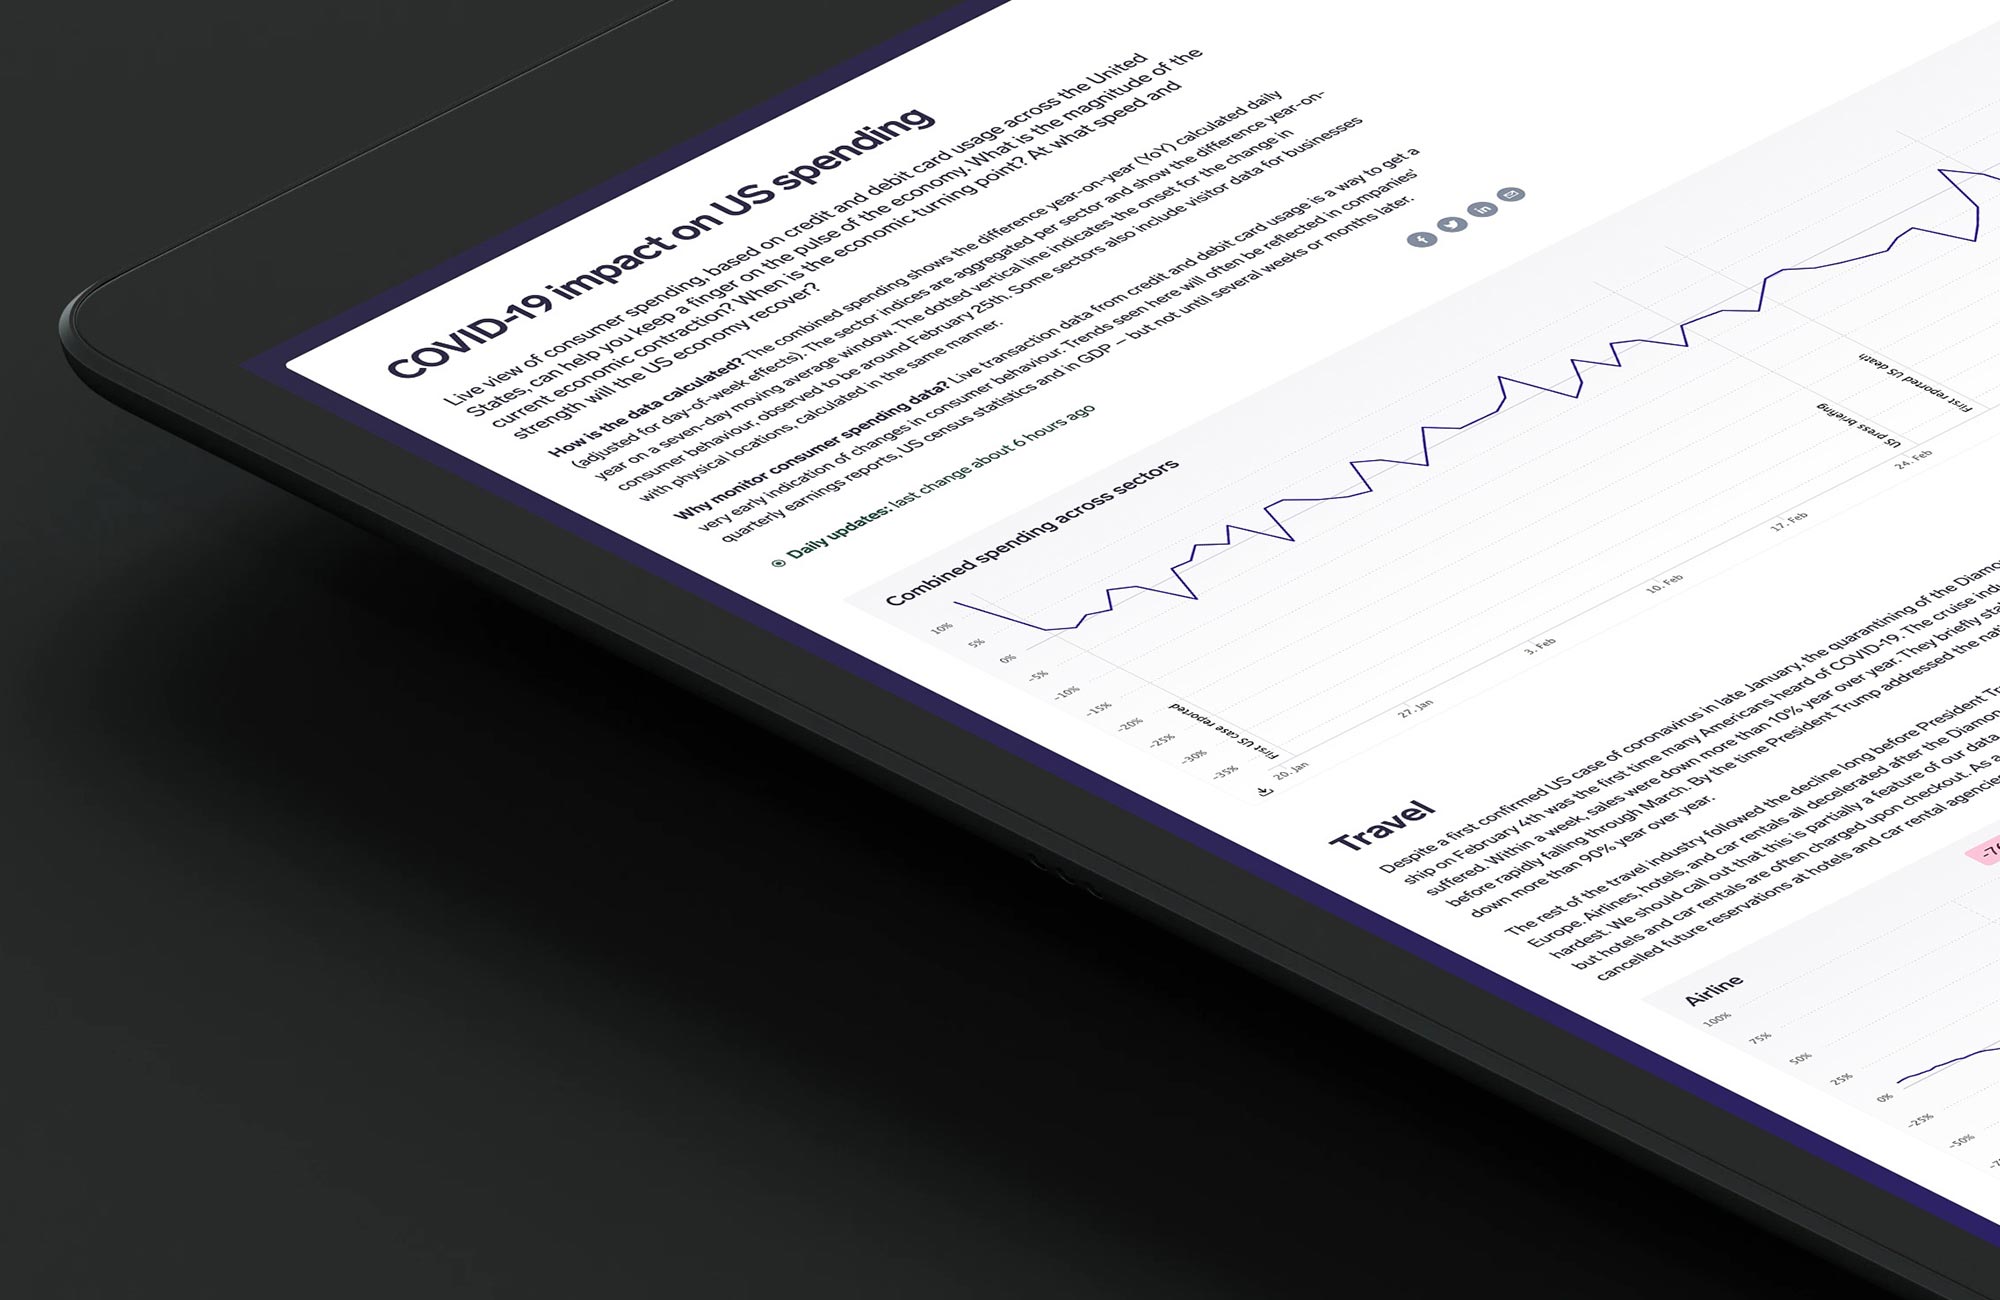
A clear breakpoint around the 25th of February
There is a significant change in consumer behaviour after the 25th of February, coinciding with the first US government press briefing on the topic. This resulted in an onset of press coverage, which is likely to have affected the way people spend their money.
Grocery stores boom while travel plummets

Across all parts of the travel sector there has been significant downturns, with cruise lines seeing the worst impact. On the other hand, staple goods and office supplies have seen major increases in spending.


